18 October 2013
We have launched a new view for your reports. Now you can view your reports in three available formats- Pie Chart, Bar Chart, and Table. A screenshot of the new table view is shown below:
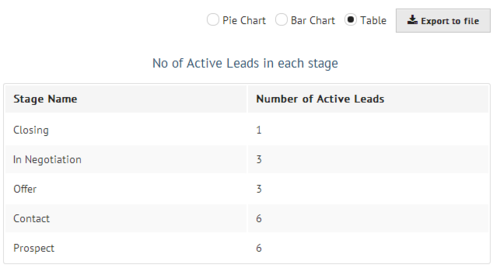
Just select the type of report that you want to see and choose the Table view from the available options. This view will help you see a numeric value against all names. You can also export this report as-is in excel and csv format.
Running your own business? The ClinchPad Blog is a blog about growing your business and productivity.
5 Great Strategies to Build Customer Engagement
6 Pratical Solutions to Sales Bottlenecks
5 Simple Tips to Improve Your Sales Forecasts
6 Effective Tips for Successful Cold Calling
10 Quick Tips to Write a Killer Business Proposal
5 Effective Ways to Stay Profitable through Multi Channel Sales
The Buying Decision Process and Few Amazing Ways to Streamline It
4 Simple Ways to Convince Price Sensitive Customers
6 Easy Steps for a Stress Free Life
5 Simple Ideas to Speed Up Your Sales Cycle
4 Simple Steps to Build Perfect Customer Profiles
How to Improve Your Active Listening Skills and Enhance Customer Engagement.
Tips on Selling by Robert Oswald, Braintree Payments
How We Got Users To Give Feedback Via Email
How We Got Users To Give Feedback Via Email
The Cold Emails That Worked For Us
The 30 day free trial is (mostly) broken
Subscription Payment Solutions for SaaS Startups based out of India
Import your leads directly from Excel and CSV files
Now, view reports in tabular format
Organization wide view of tasks