
The ClinchPad Blog
Month
The response is encouraging but part skeptical. After all, an UI is just One Small Little Thing.
We have launched a new view for your reports. Now you can view your reports in three available formats- Pie Chart, Bar Chart, and Table. A screenshot of the new table view is shown below:
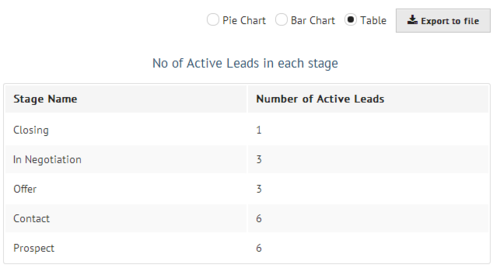
Just select the type of report that you want to see and choose the Table view from the available options. This view will help you see a numeric value against all names. You can also export this report as-is in excel and csv format.

It’s a good sign in a relationship if you are able finish each other’s sentences right? Well, it isn’t a rule that’s set on in stone. It’s an awesome trait to possess when you are around your significant other, but is really bad manners when you are interacting with someone you share a professional relationship with.